
10 Facts You Need to Know to Achieve Investment Success
Feb 7, 2020 • Written by Paul Staib | Certified Financial Planner (CFP®), MBA, RICP®
Blog Home » Financial Planning » 10 Facts You Need to Know to Achieve Investment Success

You can implement an ideal investment portfolio, but if you don’t stay invested, your chances of reaching your goals will be diminished. Investors often abandon their portfolios because they were not properly prepared for the experience of investing.
This article contains some facts intended to help address this problem. You may already “know” these facts, but they are excellent principles to reinforce to help you achieve investment success.
The good thing is you do not need to become an investment expert. But you do need to know how to behave like a successful investor in order to achieve your goals. Understanding these 10 facts will help you on your journey to a secure financial future.
1. Over time, the stock market goes up
As the chart below indicates, the stock market is resilient and over time it consistently moves “up and to the right”. On average, it rises a little more on the up days than it declines on the down days. This pattern has produced a distinctively upward trend over the long-term. This is not a coincidence. It reflects the fact that, on average, the earnings of the companies whose shares are traded on the market rise over time.
Growth of the US Stock Market
1900-2019
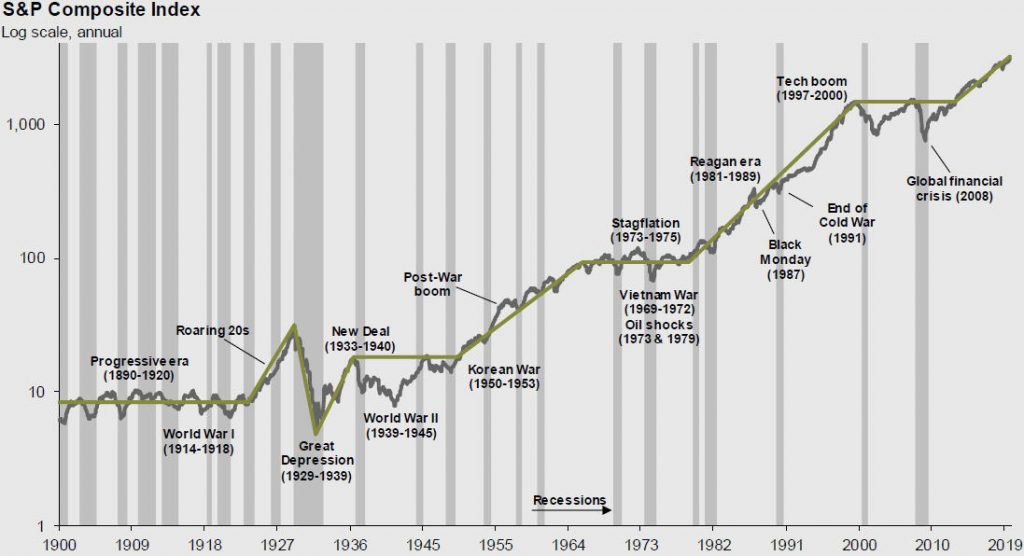
Source: J.P. Morgan Asset Management, 2019 Retirement Guide
2. The ride up is not a smooth one
Viewing the upward trend of the stock market from a long-term historical perspective masks an unpleasant reality. A closer, shorter-term view shows that the market line often resembles a jagged saw blade that can deeply cut even the most seasoned investor. The graphic below illustrates the price movement of the S&P 500 from 1996 – 2019, a period that includes some of the most dramatic performance swings in market history, including the Tech Bubble (’99-’01) and the Great Recession (’07-’08). This time period contained some whipsaw fluctuations – including a market increase of 106%, followed by a drop of 49%, an increase of 101%, a decrease of 57%, and finally an increase of 378%+!
Growth of the US Stock Market
1996-2019
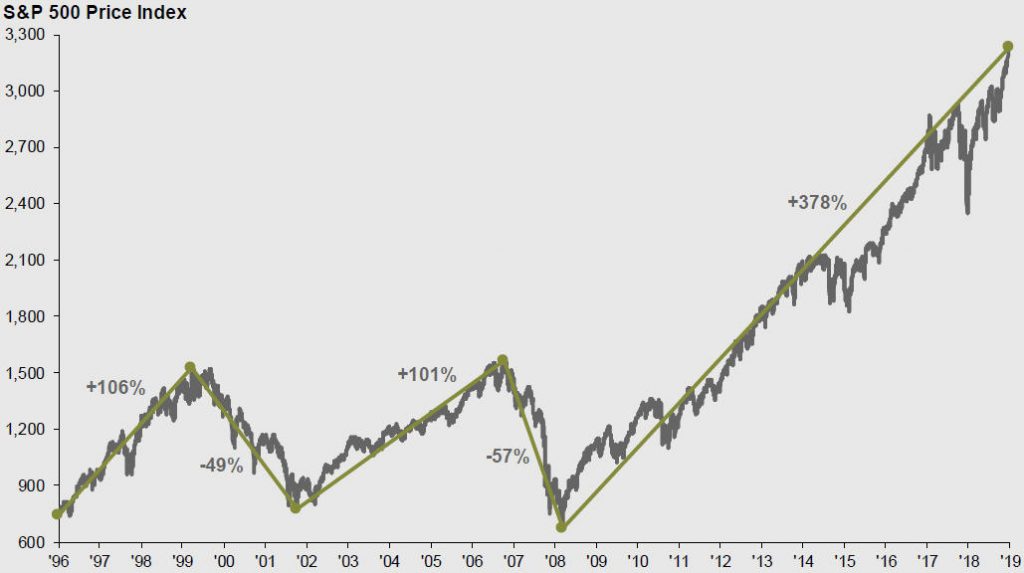
Source: J.P. Morgan Asset Management, 2019 Retirement Guide
Since 1926 there have been 11 bear markets (market declines of at least 20%) and 12 bull markets (market gains of at least 20%). During that period, there have been over 20 “corrections,” market declines of between 10% and 20% that occurred during bull markets. The graphic below illustrates the intra-year return declines along with the calendar year returns of the S&P 500 since 1980. While annual returns are positive in 30 of the 40 years, in each year there were relatively significant declines within the year.
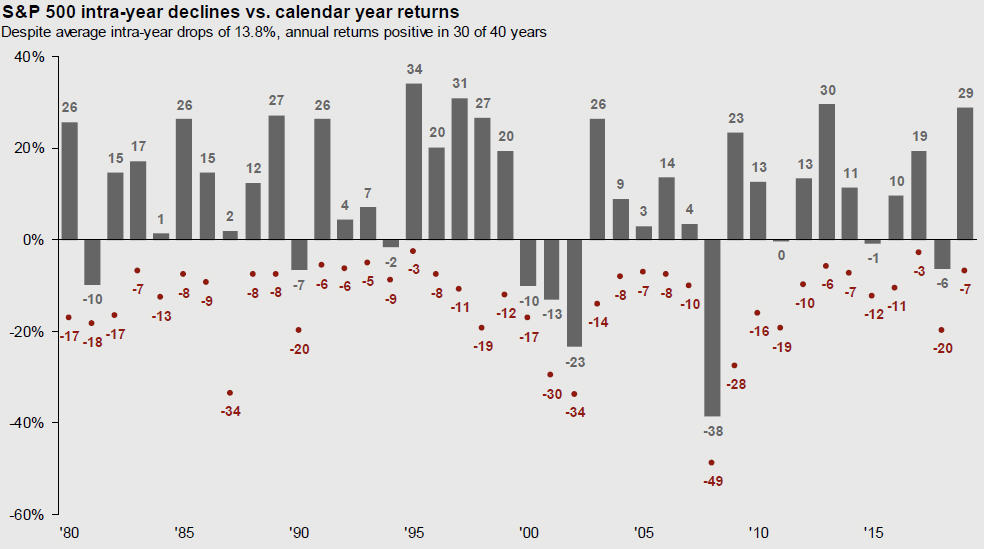
Source: J.P. Morgan Asset Management, 2019 Guide to the Markets
During periods of market volatility many investors forget about the market’s historic upward trend. Instead, they become anxious and fearful. This is understandable from a human perspective. The stress of market volatility triggers our deeply engrained fight or flight response. But it is not conducive to investment success.
Successful investors expect and prepare themselves mentally for the bumps. It’s like flying in an airplane. If we travel long enough, we know we will encounter turbulence. But we deal with it because it is an unavoidable part of the journey to our ultimate destination.
3. The Probabilities
The chart below shows the historical distribution of US market returns since 1970 (the past 50 years). The average return during the period was 12%. A couple of noteworthy observations:
- the market had positive annual returns ~75% of the time, negative annual returns ~25% of the time;
- ~40% of the time the annual market returns exceeded 20%;
- ~60% of the time the annual market returns exceeded 10%;
- ~85%+ of the time the annual market returns exceeded -10%;
- ~6% of the time the annual market returns were less than -20%
- Annual returns vary widely (ranging from -36.7% to +38.8%) and rarely do investors experience the “average return” in any given year (only in 2004 in this sample)
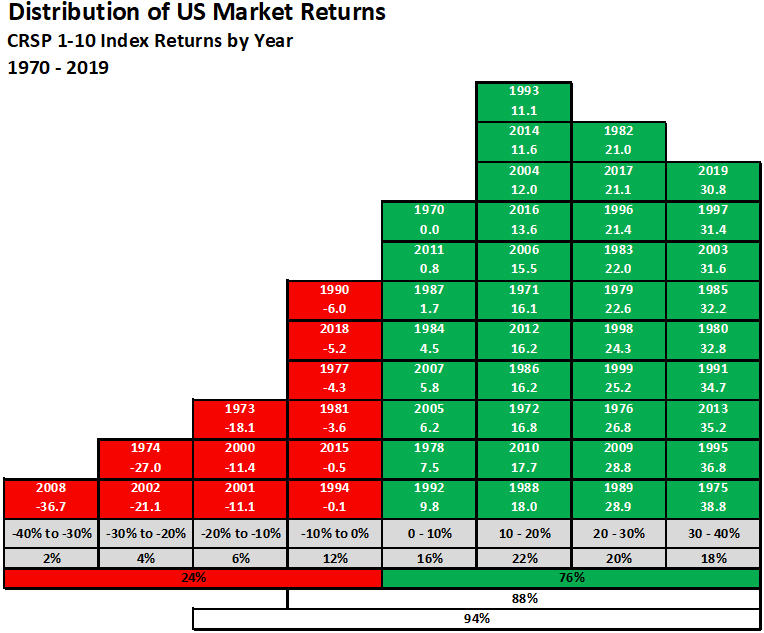
While events like the stock market meltdown in 2008 stick out in our minds for causing so much anxiety, the chart above shows that events such as these are rare, and not the norm. History shows that the stock market has rewarded investors who can bear the risk of stocks and stay committed through various periods of performance over the long-term through the use of a well-diversified portfolio.
4. You can’t avoid the bumps – you must prepare for them
Everyone dreams of an investment process that has you in the market when it’s going up and gets you out when it’s going down. But, such an investment process is just that – a dream.
Market timing seems like it should be simple because – like flipping a coin – there are only two alternatives. Either you are in the market or you are out of it.
But securities markets are complex adaptive systems driven by many variables. Economics, politics, acts of God, company-specific results, and human behavior all play a role. It isn’t possible to consistently account for all these factors and the impact they have on the markets.
The problem isn’t that market timing never works. The problem is that it works just enough to give you hope, but not enough to improve performance over the long-term.
A 2016 study by Wim Antoons, Market Timing: Opportunities and Risk, made the point. Antoons reviewed predictions made by 68 market timing gurus between 1999 and 2012. The data showed that 42 of the 68 gurus (61.8%) were accurate less than 50% of the time.
Antoon dug further into the predictions made by those timing gurus for the period 2005 through 2012 – a total of 6,582 forecasts. He found that “after transaction costs, no single market timer was able to make money.” He concluded: “There are two kinds of investors: those who don’t know where the market is going and those who don’t know what they don’t know.”
“The idea that a bell rings to signal when investors should get into or out of the market is simply not credible. After nearly 50 years in this business, I do not know of anybody who has done it successfully and consistently. I don’t even know anybody who knows anybody who has done it successfully and consistently.”
— John C. Bogle
5. Stock market performance is determined by a few good days
Trying to time the market is extremely difficult to do. Market lows often result in emotional decision making. Investing for the long term while managing volatility can result in a better outcome.
A major obstacle to successful market timing is the fact that the stock market’s long-term returns are driven by the performance on a few very good days. If you are sitting on the sidelines on these few precious days, your portfolio’s performance will suffer.
This graphic illustrates the point. It looks at an investment of $10,000 in the S&P 500 Index over the 20-years from 1999 through 2018, a period that includes over 5,000 trading days.
Effect of Best Market Days
1999-2018
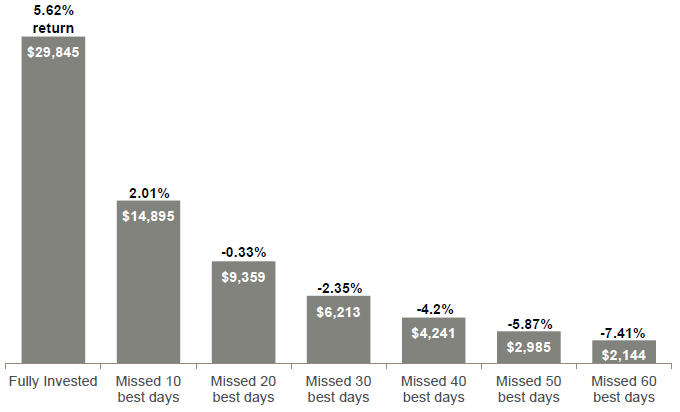
Source: J.P. Morgan Asset Management, 2019 Retirement Guide
An investor who remained fully invested during this period would have had an annualized return of 5.62%. Not bad for a period that included the Tech Bubble (’99-’00) and the Great Recession (’07-’09).
But missing just the 10 best days (0.2% of the total trading days) would have reduced that return by more than 64%. Missing the 20 best days (0.4% of the total trading days) would have resulted in a negative return for the period. Less than one-half of one percent of the total trading days determined the difference between a solid positive return and a loss. Additionally, six of the best 10 days occurred within two weeks of the 10 worst days.
A market timer must correctly call each market downturn and then precisely time getting back into the market to avoid missing the handful of best days that provide most of the market’s positive performance. This is an impossible task and the consequences of failure are severe.
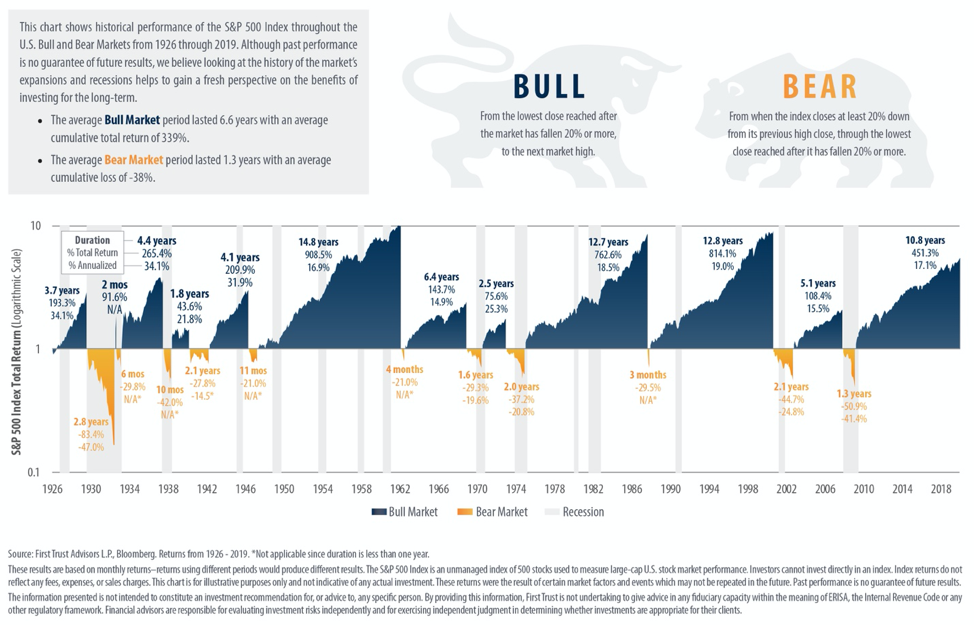
6. Bull Markets are greater than Bear Markets in Duration and Magnitude
The market timer’s focus on missing the bad days puts the focus in the wrong place. It’s far more important to be in the market when it is rising than to avoid the infrequent periods of market decline.
Simply put, bull markets last far longer than bear markets. The losses in bear markets are much smaller than the gains in bull markets. Painful as it may be, you are better off suffering through the down markets than missing the longer, stronger up markets.
The average bear market since 1926 lasted just 1.3 years. The average bull market lasted 6.6 years. Average losses from bear markets were a cumulative -38%. Average gains from bull markets were a cumulative 339%. The graphic below tells the story.
Diversification means spreading the assets in a portfolio among different investments. Diversification works in two ways. First, by putting our eggs in many baskets we reduce the impact on our portfolio of anything negative happening to any one of them. Second, by intentionally combining investments with different performance characteristics, like stocks and bonds, declines in the value of one investment can be minimized or offset by smaller declines or even gains in another.
The primary goal of diversification is to smooth out the returns of the portfolio. For most investors, a smoother ride increases their willingness to stay invested and not abandon their strategy. Staying invested dramatically improves the likelihood they will achieve their long-term investment objectives. The graphic below illustrates the returns associated with a diversified portfolio (“Asset Allocation”) vs the returns of the individual asset classes.
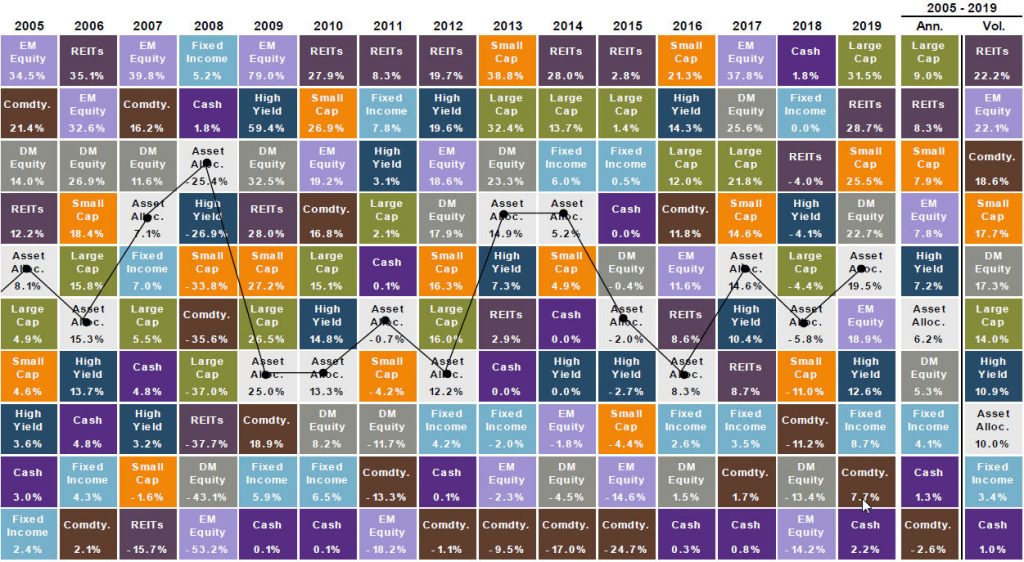
Source: J.P. Morgan Asset Management, 2019 Guide to the Markets
Diversification means there will always be some investments in the portfolio that are performing better than others. The components of the portfolio will cycle in and out of favor over time with each contributing during different market cycles.
It’s natural to focus negative attention on the underperforming investments. Yet, it’s more productive to focus on the performance of the overall portfolio. Investors reach their goals based on the performance of the sum of the parts, not the performance of any one of them.
8. Active managers rarely generate persistent outperformance
Long-term investment portfolios are commonly constructed using mutual funds, exchange-traded funds (ETFs), individual securities, or some combination of them. Both the portfolios and their components are managed using one of two approaches: active or passive.
Passively managed portfolios are typically managed to track the performance of an index. For example, there are dozens of funds and ETFs that track the performance of the S&P 500 Index.
Passively managed portfolios make no effort to outperform the indexes they track. They simply purchase all or some of the stocks in the index they are tracking in an effort to mimic the performance of the index. They don’t make qualitative judgments about which stocks to hold.
Actively managed portfolios have defined investment objectives and their managers have broad discretion in how to reach those objectives. Active managers make decisions about which securities to include in their portfolios and which to exclude. They make judgments about the future.
Both approaches to investing can have a place in helping investors reach their long-term financial goals. But investors should not expect active managers to outperform relevant benchmarks or their peers on a consistent basis.
Standard & Poor’s regularly tracks the persistence of active manager performance. As of June 30, 2019, S&P found that over the preceding year, 71% of all domestic equity funds had underperformed their benchmarks after fees. Over the preceding five years, 82% of all domestic equity funds had underperformed. Over the preceding 10 years, 88% underperformed.
That doesn’t mean active managers can’t add value, but it does mean that yesterday’s top managers are unlikely to stay on top going forward.
9. Expenses Matter!
Investment costs add up and compound over time. You don’t just lose the amount you pay in fees – you also lose all the growth that money would have generated for years into the future.
Every mutual fund or ETF in a portfolio has an “internal expense ratio.” This is the amount charged by the fund company for managing the fund. Those expense ratios can vary widely. Mutual fund and ETF expense ratios are also a very strong predictor of future fund performance.
A 2010 study by Morningstar and a 2016 study by Vanguard showed that in every asset class over every time period, the low expense funds outperformed the high expense funds.
Trading costs are also a drag on performance. Those costs may be highly visible, like commissions, or less obvious, like the spread between a bid and an ask price, but they are there, nonetheless. The more a fund buys and sells securities, the greater those costs.
Here’s an example that illustrates the importance of minimizing fees and expenses. Dozens of funds in the Morningstar database track the S&P 500 Index. Many have internal expense ratios of 0.05% or less, while others have internal expense ratios of 1.00% or more. The chart below shows the growth of $1 million invested in the S&P 500 index over the 25 years ending in 2018. It also shows the return you would have received if you had invested $1 million in an S&P index fund with a 0.05% expense ratio vs. a fund with a 1.00% expense ratio.
Growth of $1 million
(1994-2018)
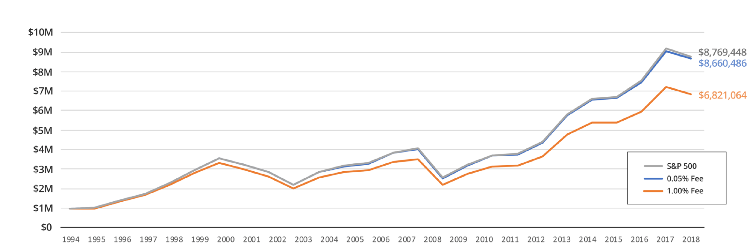
Source: Morningstar and First Ascent Asset Management
The difference between investing in the low-expense versus the high-expense fund – $1,839,422 – comes out of your pocket. It could fund years of retirement!
10. Nothing works all the time
There are general rules and sound approaches to investing that make sense over the long-term. But none of them work all the time.
Regardless of the approach you take to investing, there will be times when even the best-constructed portfolio fails to achieve its objectives. When this happens, you may doubt the wisdom of your strategy. But it’s important not to get frustrated and abandon your strategy.
Investing is a probabilistic exercise. You take actions that are designed to improve your odds of success over the long-term. But there are no guarantees, particularly in the short-term.
A good example is investing in the stock market. As we have seen, there are many times when the market declines in value. Some of the declines are quite dramatic. Holding stocks during those periods feels terrible and can create doubt about the wisdom of that strategy. But the market has always turned around and rewarded the patient and disciplined investor.
In the short-term, there are no hard and fast rules – no sure things. But over the long-term there are approaches to investing that are more likely than others to produce positive outcomes. Be prepared for deviations from historic norms, some of which last a long time.
And finally, some advice
Understanding the 10 facts above will help you develop the mindset of a successful investor. Here’s some advice to go along with those facts.
You can’t control the direction of the markets, but you can control how you react to them. Be patient and disciplined. Don’t act based on emotion.
It takes knowledge and experience to develop and manage a solid, investment strategy tailored to one’s goals. But don’t view investing as an intellectual exercise where the smartest person in the room wins. You can’t outsmart the securities markets. However, by understanding how those markets work, you can learn how to behave in a manner that will improve the likelihood of a positive investment outcome. Stay focused on your own personal goals. Don’t worry about beating the market (or your neighbor), following the crowd, or acting on the latest hot tip from today’s most popular guru. If you are making good progress toward your goals, you are a successful investor.
History shows that the stock market has rewarded investors who can bear the risk of stocks and stay committed through various periods of performance over the long-term through the use of a well-diversified portfolio.

Paul Staib | Certified Financial Planner (CFP®), MBA, RICP®
Paul Staib, Certified Financial Planner (CFP®), RICP®, is an independent Flat Fee-Only financial planner. Staib Financial Planning, LLC provides comprehensive financial planning, retirement planning, and investment management services to help clients in all financial situations achieve their personal financial goals. Staib Financial Planning, LLC serves clients as a fiduciary and never earns a commission of any kind. Our offices are located in the south Denver metro area, enabling us to conveniently serve clients in Highlands Ranch, Littleton, Lone Tree, Aurora, Parker, Denver Tech Center, Centennial, Castle Pines and surrounding communities. We also offer our services virtually.
Read Next
6 Key Reasons Why Investing in a Taxable Account Is Underrated
• Written By Paul Staib | Certified Financial Planner (CFP®), MBA, RICP®
Investors are often schooled in the virtues of stashing money in tax-sheltered savings vehicles, whether IRAs, company retirement plans, 529s,…
When Should You Take Social Security?
• Written By Paul Staib | Certified Financial Planner (CFP®), MBA, RICP®
Key Points Taking Social Security benefits before you reach full retirement age may not be the wisest choice. We’ll cover…